4QFY2016 Result Update | Pharmaceutical
June 10, 2016
IPCA Laboratories
BUY
CMP
`431
Performance Highlights
Target Price
`613
Y/E March (` cr)
4QFY2016 3QFY2016 % chg (QoQ) 4QFY2015
% chg (yoy)
Investment Period
12 Months
Net sales
612
674
(9.2)
623
(1.7)
Other income
18
15
22.9
20
(7.0)
Stock Info
Operating profit
51
79
(35.6)
28
80.1
Sector
Pharmaceutical
Tax
(16)
16
(199.2)
(3)
349.6
Adj. net profit/(loss)
38
24
58.9
(10)
-
Market Cap (` cr)
5,846
Source: Company, Angel Research
Net Debt (` cr)
337
Beta
0.6
IPCA Laboratories (Ipca)’s results for 4QFY2016 have come in much lower than
52 Week High / Low
888/402
our expectations on the sales and the operating front, while a tax write-back led
Avg. Daily Volume
49,999
the net profit to outperform our estimates. Sales for the quarter de-grew 1.7%
Face Value (`)
2
yoy to `612cr (V/s `680cr expected). On the operating front, the gross margin
BSE Sensex
26,636
came in at 64.4% V/s 58.8% in 4QFY2015, while the EBDITA margin came in at
Nifty
8,170
8.4% V/s 4.6% in 4QFY2015. The reported net profit for the quarter thus came
Reuters Code
IPCA.BO
in at `38cr V/s `8cr in 4QFY2015 while the Adj. net profit stood at `38cr V/s a
Bloomberg Code
IPCA@IN
loss of `10cr in 4QFY2015. While the current performance of the company is
being impacted due to its key plants being under the USFDA scanner, we believe
once out of it, the company can bounce back to its normalized ROE of 25%. Thus,
Shareholding Pattern (%)
we maintain our Buy on the stock.
Promoters
45.9
MF / Banks / Indian Fls
19.8
Results lower than expectations: For the quarter, the company’s sales declined by
FII / NRIs / OCBs
22.1
1.7% yoy to `612cr (V/s `680cr expected). The dip in the sales was owing to a
Indian Public / Others
12.2
26% yoy decline in API sales (`114cr), while Formulations (`498cr) posted a yoy
growth of 6.0%. Within formulations, domestic formulations posted a yoy growth
of 9%. On the operating front, the gross margin came in at 64.4% V/s 58.8% in
Abs. (%)
3m 1yr
3yr
4QFY2015, while the EBDITA margin came in at 8.4% V/s 4.6% in 4QFY2015. The
Sensex
8.2
(0.8)
37.0
reported net profit for the quarter thus came in at `38cr V/s `8cr in 4QFY2015 while
Ipca
(15.0)
(27.8)
(23.3)
the, Adj. net profit stood at `38cr V/s a loss of `10cr in 4QFY2015.
Outlook and Valuation: We expect net sales to post a 15.6% CAGR to `3,799cr,
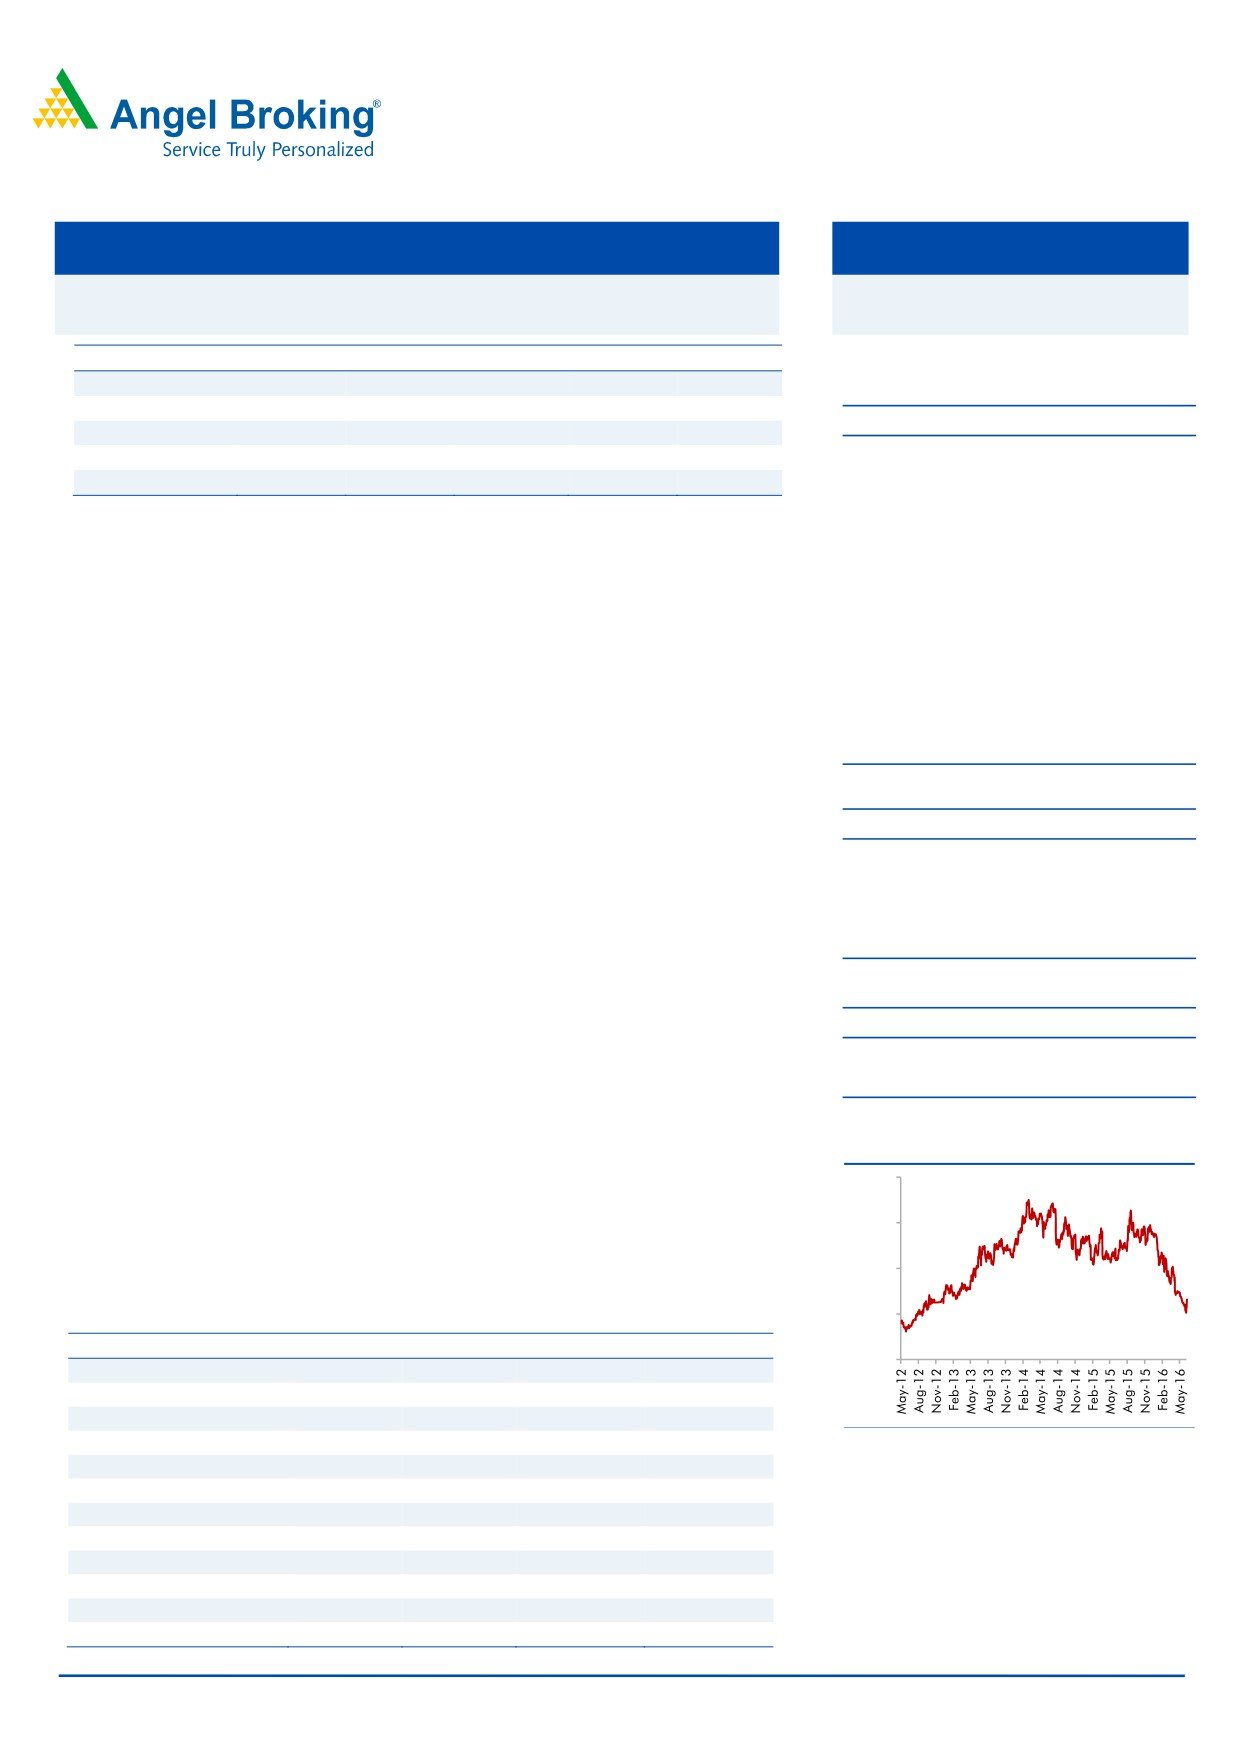
3-Year Daily Price Chart
and EPS to register a 36.5% CAGR to `19.7 over FY2016-18E. The company’s
1,000
financials will be impacted by the USFDA import alert on the Ratlam, Indore and
Silvassa facilities. While the problems are likely to persist for a while, we expect the
800
company’s performance to witness a gradual pick-up going forward. Given the
600
valuations, we maintain our Buy rating on the stock with a price target of `613.
400
Key financials (Consolidated)
Y/E March (` cr)
FY2015
FY2016
FY2017E
FY2018E
200
Net sales
3,117
2,844
3,303
3,799
% chg
(2.6)
(8.7)
16.1
15.0
Adj. Net profit
254
133
219
248
% chg
(48.6)
(47.6)
64.2
13.5
Source: Company, Angel Research
EPS
20.1
10.6
17.3
19.7
EBITDA margin (%)
16.2
10.6
15.3
15.3
P/E (x)
21.2
40.4
24.6
21.7
RoE (%)
12.2
5.9
9.1
9.4
RoCE (%)
10.9
4.1
8.4
8.8
P/BV (x)
2.4
2.3
2.1
2.0
Sarabjit Kour Nangra
EV/Sales (x)
1.9
2.0
1.7
1.5
+91 22 39357800 Ext: 6806
EV/EBITDA (x)
11.9
19.0
11.4
10.1
Source: Company, Angel Research; Note: CMP as of June 7, 2016
Please refer to important disclosures at the end of this report
1
Ipca Laboratories | 4QFY2016 Result Update
Exhibit 1: 4QFY2016 - Standalone performance
Y/E March (` cr)
4QFY2016 3QFY2016
% chg (qoq)
4QFY2015
% chg (yoy) FY2016 FY2015
% chg (yoy)
Net sales
612
674
(9.2)
623
(1.7)
2844
3060
(7.0)
Other income
18
15
22.9
20
(7.0)
57
65
(11.6)
Total income
630
689
(8.5)
642
(1.8)
2902
3125
(7.1)
Gross profit
395
423
(6.8)
366
7.8
1787
1917
(6.8)
Gross margins (%)
64.4
62.8
58.8
62.8
62.6
Operating profit
51
79
(35.6)
28
80.1
262
495
(47.1)
Operating margin (%)
8.4
11.8
4.6
9.2
16.2
Interest
8
9
(11.4)
8
(2.2)
32
26
21.6
Depreciation
39
45
(12.5)
58
(32.0)
172
177
(2.7)
PBT
22
40
(45.2)
(18)
-
112
352
(68.2)
Provision for taxation
(16)
16
(199.2)
(3)
349.6
19
102
(81.8)
Less: Exceptional Items
0
1
(23)
0
0
(gains)/ loss
Reported Net profit
38
23
62.6
8
-
93
254
(63.3)
Adj. Net profit/(loss)
38
24
58.9
(10)
-
93
254
(63.3)
EPS (`)
2.9
1.8
(0.8)
7.3
19.8
(63.3)
Source: Company, Angel Research, FY numbers are consolidated
Exhibit 2: 4QFY2016 - Actual vs Angel estimates
(` cr)
Actual
Estimates
Variation (%)
Net sales
612
680
(10.0)
Other income
18
18
(0.1)
Operating profit
51
83
(38.5)
Interest
8
8
(0.1)
Tax
(16)
11
-
Adjusted Net profit/(loss)
38
28
33.5
Source: Company, Angel Research
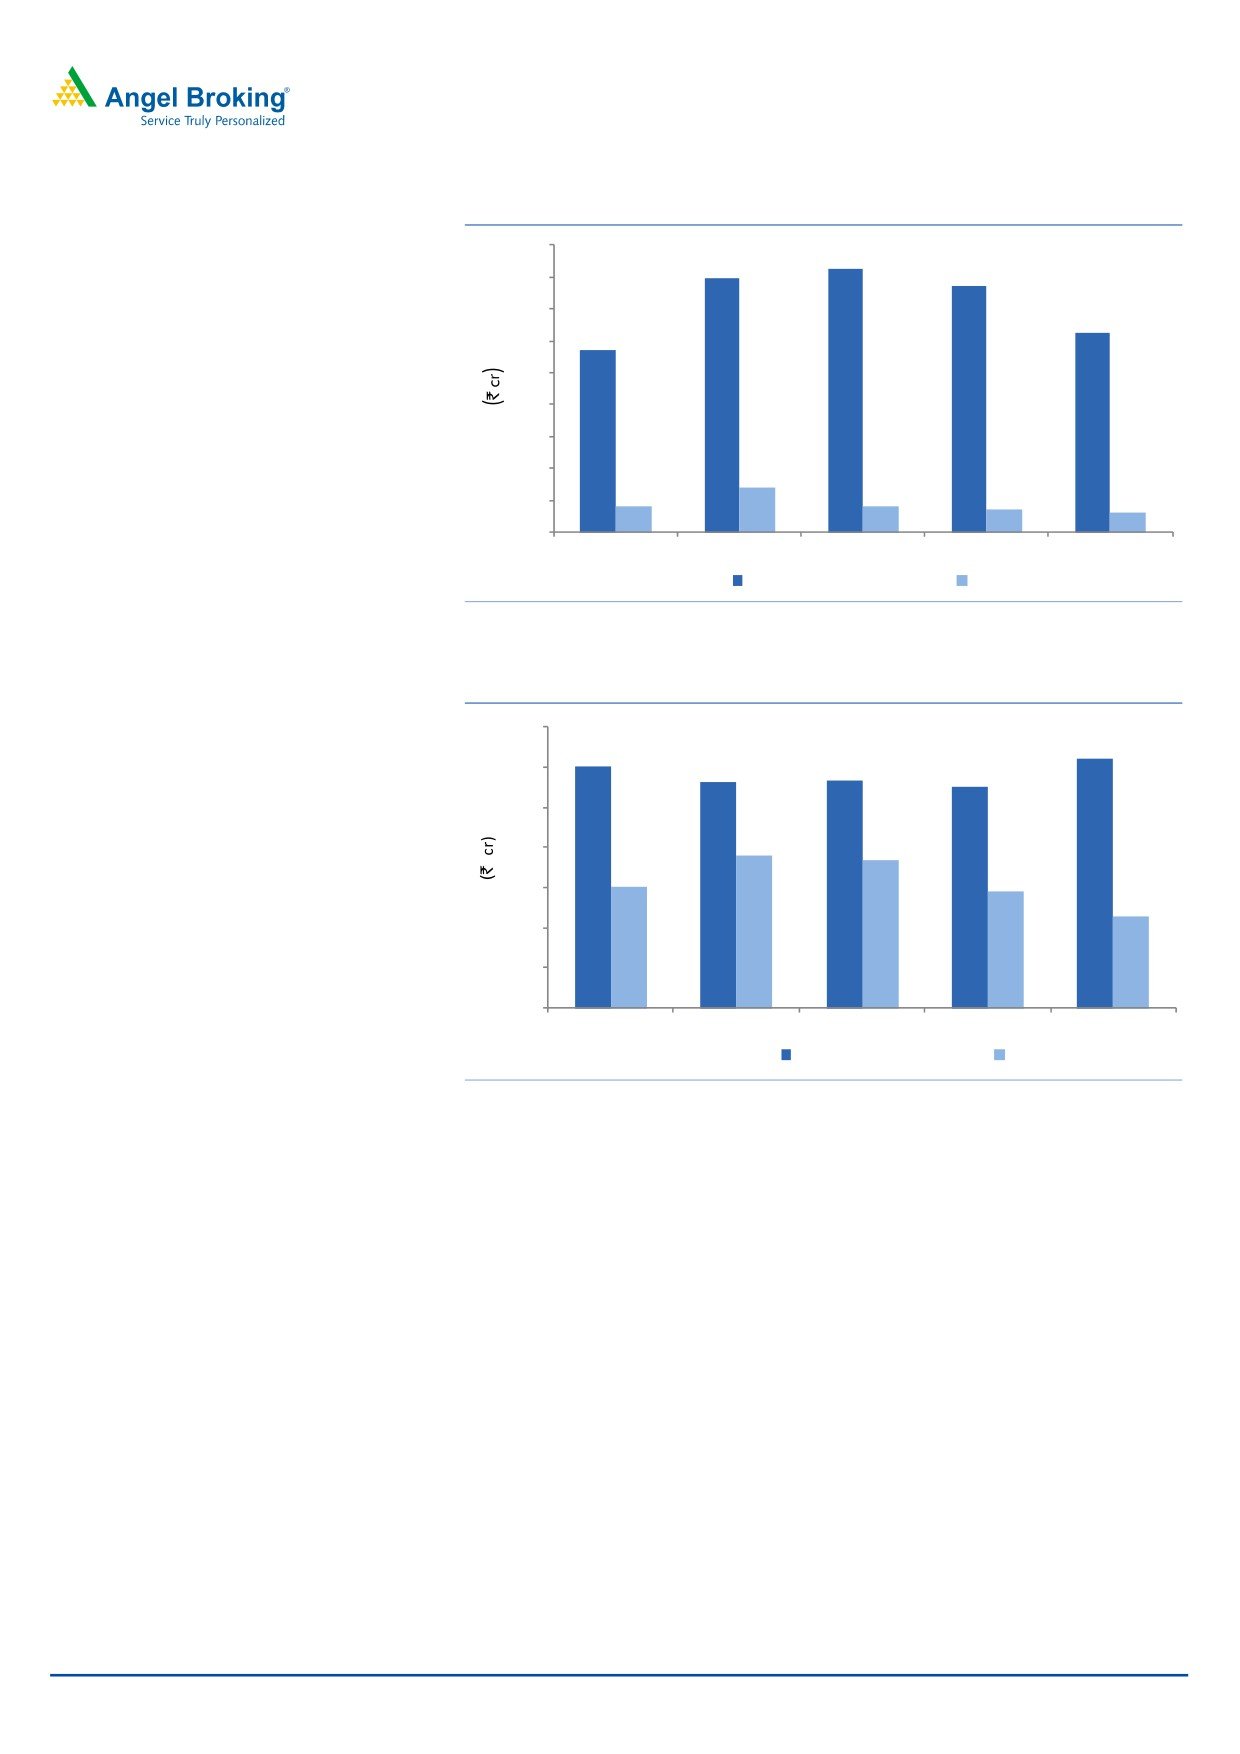
Revenue below our estimate; dips 1.7% yoy: For the quarter, the company’s sales
declined by 1.7% yoy to `612cr (V/s `680cr expected). The dip in the sales was
owing to a 26% yoy decline in API sales (`114cr), while Formulations (`498cr)
posted a yoy growth of 6.0%. Within formulations, domestic formulations posted a
yoy growth of 9%.
Domestic markets (`273cr) posted a growth of 4.4% yoy. API sales at `24cr
de-grew by 27.6% yoy, while Formulation sales at `250cr grew by 9.0% yoy.
Exports (`339cr) dipped by 6.1% yoy; API exports dipped by 25.1% yoy (`91cr),
while Formulation exports (`249cr) posted a yoy growth of 3.5%.
Overall, for 4QFY2016, exports contributed 55.4% to the top-line while the
domestic business contributed by around 44.6%. The overall contribution of
formulation sales is at 81.3% of total sales, for the quarter.
June 13, 2016
2
Ipca Laboratories | 4QFY2016 Result Update
Exhibit 3: Domestic sales trend
360
331
318
308
320
280
250
229
240
200
160
120
80
56
33
33
28
40
24
0
4QFY2015
1QFY2016
2QFY2016
3QFY2016
4QFY2016
Formulation
API
Source: Company, Angel Research
Exhibit 4: Exports sales trend
280
249
240
225
227
240
221
200
152
147
160
121
117
120
91
80
40
0
4QFY2015
1QFY2016
2QFY2016
3QFY2016
4QFY2016
Formulation
API
Source: Company, Angel Research
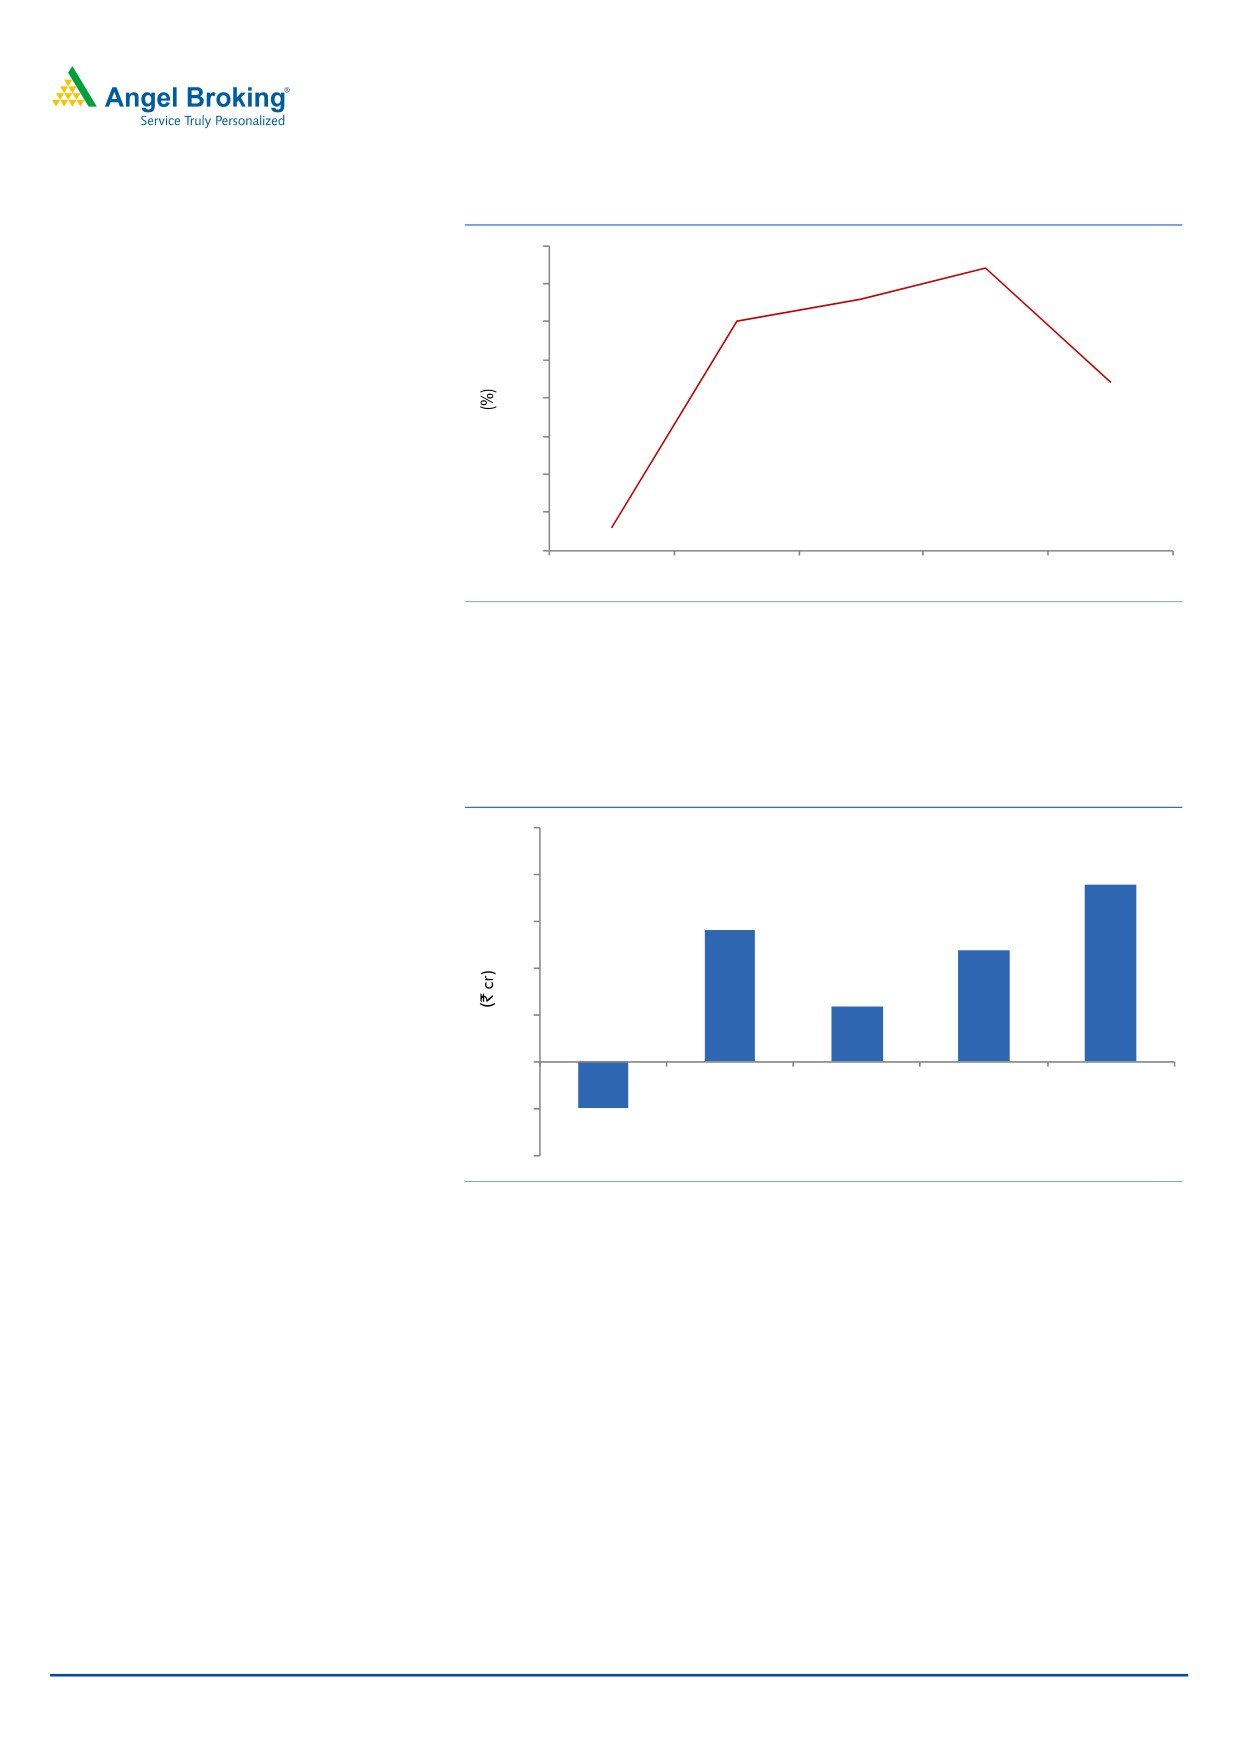
OPM falls sharply: On the operating front, the gross margin came in at 64.4% V/s
58.8% in 4QFY2015 on back of an improved sales mix, while the EBDITA margin
came in at 8.4% V/s 4.6% in 4QFY2015. The margins growth during the quarter
was restricted by the dip in sales. The company had posted an OPM of 11.8% in
3QFY2016. The decline was also owing to a large amount of fixed costs in the US
and the Institutional business remaining unabsorbed, and remediation cost on US
facilities also continued to be incurred during the quarter. Overall, the base
business’ margin remained muted at ~14-15% in 4QFY2016. The margins are
likely to improve once the US business picks up, which would be hopefully by
FY2018.
June 13, 2016
3
Ipca Laboratories | 4QFY2016 Result Update
Exhibit 5: OPM trend
12.0
11.4
11.0
10.6
10.0
10.0
9.0
8.4
8.0
7.0
6.0
4.6
5.0
4.0
4QFY2015
1QFY2016
2QFY2016
3QFY2016
4QFY2016
Source: Company, Angel Research
Reported net profit outperforms our estimates: The reported net profit thus came in
at `38cr V/s `8cr in 4QFY2015 while the Adj. net profit stood at `38cr V/s a loss
of `10cr in 4QFY2015.
Exhibit 6: Adj. Net profit trend
50
38
40
28
30
24
20
12
10
0
4QFY2015
1QFY2016
2QFY2016
3QFY2016
4QFY2016
(10)
(10)
(20)
Source: Company, Angel Research
Investment arguments
Domestic formulations business - the cash cow: Ipca has been successful in
changing its business focus to the high-margin chronic and lifestyle segments
from the low-margin anti-malarial segment. The chronic and lifestyle
segments, comprising CVS, anti-diabetics, pain-management, CNS and
dermatology products, constitute more than 50% of the company’s domestic
formulation sales. The Management has ramped up its field force significantly
with addition of divisions in the domestic formulations segment, taking the
current total strength to nearly 4,000MRs. With an expected pick-up in sales in
FY2017, we expect the domestic formulation business to grow at a CAGR of
16.2% over FY2016-18E.
Exports currently under pressure; should pickup only by FY2018: On the
formulations front, Ipca has been increasing its penetration in regulated
June 13, 2016
4
Ipca Laboratories | 4QFY2016 Result Update
markets, viz Europe and the US, by expanding the list of generic drugs backed
by its own API. In the emerging and semi-regulated markets, the company
plans to focus on building brands in the CVS, CNS, pain-management and
anti-malarial segments along with tapping new geographies. On the API front,
where the company is among the low-cost producers, it is aggressively
pursuing supply tie-ups with pharmaceutical MNCs.
After the USFDA inspection at the company’s APl manufacturing facility at
Ratlam (Madhya Pradesh), the company has received certain inspection
observations in Form 483, consequent to which the company had voluntarily
decided to temporarily suspend API shipments from this manufacturing facility
to the US markets until the issue getting resolved. However, the 483 was
converted into an import alert, except for 4 APIs which constituted around 45%
of US sales in FY2014.
The company’s Silvassa and Indore facilities (formulation facilities) are also
under import alert. These developments impacted FY2015 sales, while
FY2017/FY2018 should see some revival. We expect exports to grow at a
CAGR of 15.0% over FY2016-18E.
Outlook & Valuation:
We expect net sales to post a 15.6% CAGR to `3,799cr, and EPS to register a
36.5% CAGR to `19.7 over FY2016-18E. The company’s financials will be
impacted by the USFDA import alert on the Ratlam, Indore and Silvassa facilities.
While the problems are likely to persist for a while, we expect a gradual pick-up in
performance only by FY2018. Still, given the valuations, we maintain our Buy
rating on the stock with a price target of `613.
Exhibit 7: Key Assumptions
FY2017E
FY2018E
Sales growth (%)
16.1
15.0
Domestic growth (%)
17.4
15.0
Exports growth (%)
15.0
15.0
Operating margins (%)
15.3
15.3
R&D Exp ( % of sales)
4.0
4.0
Capex (` cr)
500
500
Source: Company, Angel Research
June 13, 2016
5
Ipca Laboratories | 4QFY2016 Result Update
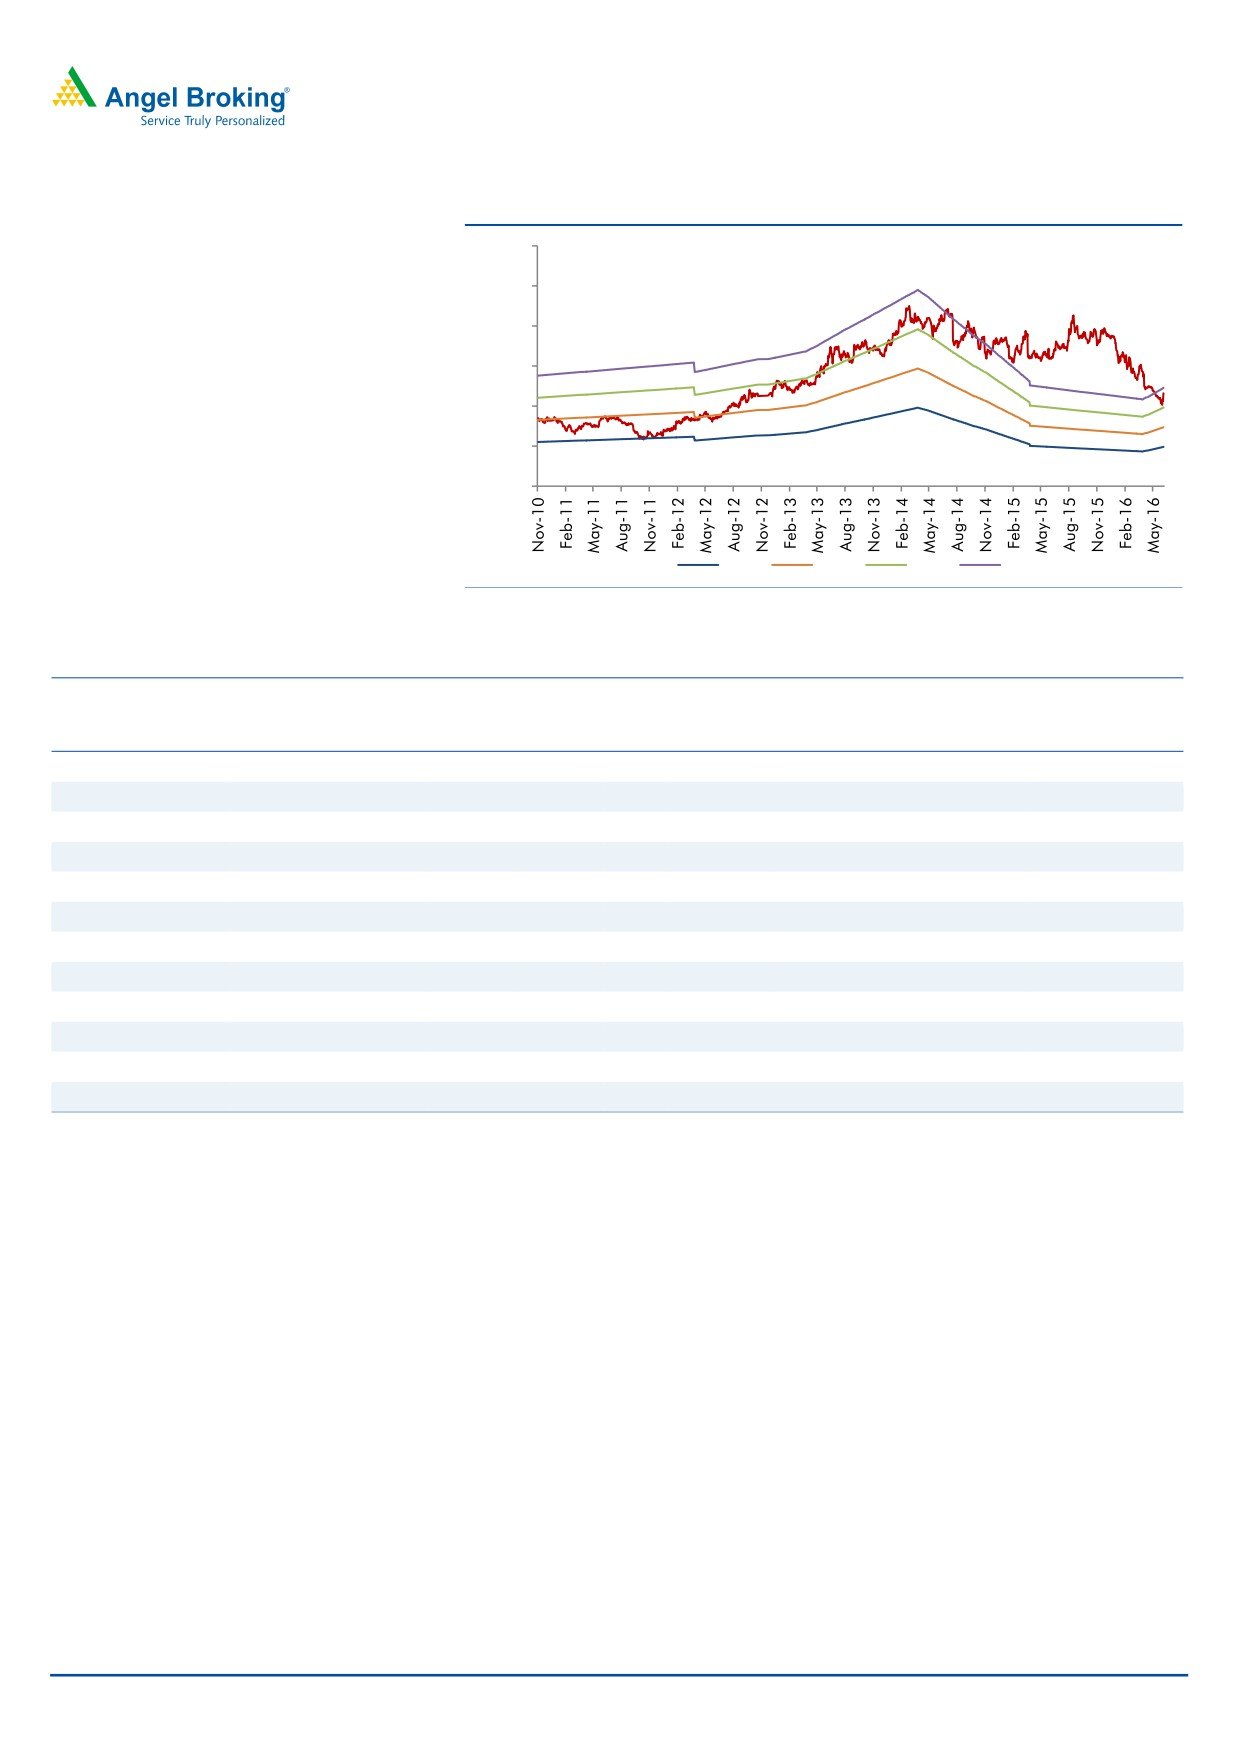
Exhibit 8: One-year forward PE band
1,200
1,000
800
600
400
200
-
10x
15x
20x
25x
Source: Company, Angel Research
Exhibit 9: Recommendation summary
Company
Reco.
CMP
Tgt Price
Upside
FY2017E
FY15-17E
FY2017E
PE
EV/Sales
EV/EBITDA
CAGR in EPS
RoCE
RoE
(`)
(`)
(%)
(x)
(x)
(x)
(%)
(%)
(%)
Alembic Pharma
Neutral
557
-
-
29.8
3.0
18.2
11.4
22.0
20.1
Aurobindo Pharma Accumulate
773
768
10.8
20.1
3.1
14.5
11.4
21.4
27.7
Cadila Healthcare
Buy
320
400
25.0
18.7
2.9
13.2
22.9
24.2
28.8
Cipla
Neutral
469
-
-
21.6
2.7
15.3
4.9
11.1
13.7
Dr Reddy's
Accumulate
3,158
3,476
10.1
20.7
3.0
12.3
6.8
19.2
18.7
Dishman Pharma
Neutral
152
-
-
15.2
1.6
7.7
15.9
9.4
11.0
GSK Pharma
Neutral
3,515
-
-
58.4
8.1
43.0
0.0
33.0
29.9
Indoco Remedies
Neutral
282
-
-
20.7
2.2
12.4
23.0
19.7
19.7
Ipca labs
Buy
431
613
42.2
24.9
1.8
11.5
7.8
8.4
9.1
Lupin
Buy
1,435
1,809
26.1
24.7
4.1
15.6
13.1
29.6
24.7
Sanofi India*
Accumulate
4,300
4,738
10.2
28.0
3.9
22.3
34.2
21.0
25.6
Sun Pharma
Buy
739
950
28.6
26.4
5.4
17.9
10.5
17.7
18.7
Source: Company, Angel Research; Note: *December year ending
June 13, 2016
6
Ipca Laboratories | 4QFY2016 Result Update
Company background
Formed in 1949, IPCA Labs is a market leader in the anti-malarials and
rheumatoid arthritis segments. The company is a notable name in the domestic
formulations category with 150 formulations across major therapeutic segments
like cardiovascular (CVS), anti-diabetes, anti-malaria, pain-management (NSAID),
anti-bacterial, central nervous system (CNS) and gastro-intestinal. The company
has 7 production units which are approved by most of the discerning regulatory
authorities including USFDA, UKMHRA, Australia-TGA, South Africa-MCC and
Brazil-ANVISA.
June 13, 2016
7
Ipca Laboratories | 4QFY2016 Result Update
Profit & loss statement (Consolidated)
Y/E March (` cr)
FY2013
FY2014
FY2015
FY2016
FY2017E
FY2018E
Gross sales
2,778
3,232
3,157
2,891
3,356
3,859
Less: Excise duty
25
33
40
47
53
61
Net Sales
2,754
3,199
3,117
2,844
3,303
3,799
Other operating income
59
82
40
41
41
41
Total operating income
2,813
3,282
3,157
2,885
3,344
3,839
% chg
19.3
16.7
(3.8)
(8.6)
15.9
14.8
Total expenditure
2,190
2,471
2,613
2,543
2,799
3,219
Net raw materials
1,097
1,137
1,155
1,058
1,173
1,349
Other mfg costs
245
250
277
253
294
338
Personnel
392
498
565
627
728
837
Other
456
587
616
606
604
695
EBITDA
564
728
504
301
504
580
% chg
19.5
29.1
(30.8)
(40.2)
67.4
15.0
(% of Net Sales)
20.5
22.8
16.2
10.6
15.3
15.3
Depreciation & amortisation
87
103
180
172
233
268
EBIT
477
625
324
129
271
312
% chg
17.8
31.1
(48.1)
(60.2)
110.3
15.0
(% of Net Sales)
17.3
19.5
10.4
4.5
8.2
8.2
Interest & other charges
33
27
28
32
32
32
Other Income
14
22
28
17
17
17
(% of PBT)
2.8
3.2
7.8
10.9
5.7
5.0
Recurring PBT
517
703
364
155
297
338
% chg
24.0
35.9
(48.2)
(57.5)
91.8
13.7
Extraordinary expense/(Inc.)
63.3
72.2
-
39.5
-
-
PBT (reported)
454
631
364
115
297
338
Tax
129.9
152.4
101.9
18.6
74.2
84.4
(% of PBT)
28.6
24.2
28.0
16.1
25.0
25.0
PAT (reported)
324
478
262
97
223
253
Add: Share of earnings of asso.
-
0
(5)
(3)
-
-
PAT after MI (reported)
324
478
254
94
219
248
ADJ. PAT
340
495
254
133
219
248
% chg
18.4
45.6
(48.6)
(47.6)
64.2
13.5
(% of Net Sales)
11.8
14.9
8.2
3.3
6.6
6.5
Basic EPS (`)
26.9
39.2
20.1
10.6
17.3
19.7
Fully Diluted EPS (`)
26.9
39.2
20.1
10.6
17.3
19.7
% chg
18.4
45.6
(48.6)
(47.6)
64.2
13.5
June 13, 2016
8
Ipca Laboratories | 4QFY2016 Result Update
Balance sheet (Consolidated)
Y/E March (` cr)
FY2013
FY2014
FY2015
FY2016
FY2017E
FY2018E
SOURCES OF FUNDS
Equity share capital
25
25
25
25
25
25
Reserves & surplus
1,529
1,934
2,183
2,281
2,485
2,718
Shareholders Funds
1,554
1,960
2,208
2,306
2,510
2,743
Minority interest
-
-
-
-
-
-
Total loans
523
603
829
595
671
809
Other Long Term Liabilities
1
1
-
-
-
-
Long Term Provisions
12
15
22
23
23
23
Deferred tax liability
130
147
174
169
169
169
Total Liabilities
2,220
2,726
3,233
3,094
3,350
3,722
APPLICATION OF FUNDS
Gross block
1,537
1,882
2,626
2,828
3,328
3,828
Less: Acc. depreciation
475
578
758
930
1,163
1,431
Net Block
1,063
1,303
1,868
1,898
2,165
2,397
Goodwill
42
50
34
34
34
34
Capital work-in-progress
129
165
165
165
165
165
Investments
9
9
16
96
96
96
Long Term Loans and Adv.
57
71
115
108
125
144
Current assets
1,397
1,602
1,614
1,522
1,767
2,032
Cash
58
76
125
162
189
223
Loans & advances
42
67
47
43
50
50
Other
1,297
1,459
1,442
1,317
1,529
1,759
Current liabilities
477
485
579
729
847
974
Net Current Assets
921
1,117
1,035
793
920
1,058
Other Non current Assets
-
9
-
-
Total Assets
2,220
2,726
3,233
3,094
3,350
3,722
June 13, 2016
9
Ipca Laboratories | 4QFY2016 Result Update
Cash flow statement (Consolidated)
Y/E March (` cr)
FY2013 FY2014 FY2015 FY2016 FY2017E FY2018E
Profit before tax
454
631
364
115
297
338
Depreciation
87
103
180
172
233
268
(Inc)/Dec in working capital
(116)
(193)
88
286
(411)
1,088
Direct taxes paid
(130)
(152)
(102)
(19)
(74)
(84)
Cash Flow from Operations
295
389
530
555
137
1,722
(Inc.)/Dec.in fixed assets
(257)
(380)
(745)
(202)
(500)
(500)
(Inc.)/Dec. in Investments
-
-
-
-
-
-
Cash Flow from Investing
(257)
(380)
(745)
(202)
(500)
(500)
Issue of Equity
0
-
-
-
-
-
Inc./(Dec.) in loans
(5)
83
232
(232)
76
138
Dividend Paid (Incl. Tax)
(59)
(74)
(15)
(15)
(15)
(15)
Others
72
1
47
(69)
419
(72)
Cash Flow from Financing
8
10
264
(316)
480
51
Inc./(Dec.) in Cash
46
18
49
37
27
38
Opening Cash balances
12
58
76
125
162
189
Closing Cash balances
58
76
125
162
189
223
June 13, 2016
10
Ipca Laboratories | 4QFY2016 Result Update
Key Ratios
Y/E March
FY2013
FY2014
FY2015
FY2016
FY2017E
FY2018E
Valuation Ratio (x)
P/E (on FDEPS)
16.0
11.0
21.4
40.8
24.9
21.9
P/CEPS
12.7
9.1
12.5
17.8
12.0
10.5
P/BV
3.5
2.8
2.5
2.4
2.2
2.0
Dividend yield (%)
0.9
0.9
0.9
0.9
0.9
0.9
EV/Sales
2.1
1.8
1.9
2.0
1.8
1.6
EV/EBITDA
10.4
8.1
12.0
19.2
11.5
10.2
EV / Total Assets
2.6
2.2
1.9
1.9
1.7
1.6
Per Share Data (`)
EPS (Basic)
26.9
39.2
20.1
10.6
17.3
19.7
EPS (fully diluted)
26.9
39.2
20.1
10.6
17.3
19.7
Cash EPS
33.8
47.4
34.4
24.2
35.8
40.9
DPS
4.0
5.0
1.0
1.0
1.0
1.0
Book Value
123.1
155.3
175.0
182.7
198.9
217.4
DuPont Analysis
EBIT margin
17.3
19.5
10.4
4.5
8.2
8.2
Tax retention ratio
71.4
75.8
72.0
83.9
75.0
75.0
Asset turnover (x)
1.4
1.4
1.1
1.0
1.1
1.2
ROIC (Post-tax)
17.2
20.2
8.2
3.6
6.8
7.1
Cost of Debt (Post Tax)
4.5
3.6
2.9
3.7
3.7
3.2
Leverage (x)
0.4
0.3
0.3
0.3
0.2
0.2
Operating ROE
21.8
24.9
9.8
3.6
7.3
7.9
Returns (%)
RoCE (Pre-tax)
23.2
25.3
10.9
4.1
8.4
8.8
Angel RoIC (Pre-tax)
25.0
27.7
12.0
4.5
9.4
9.9
RoE
24.2
28.2
12.2
5.9
9.1
9.4
Turnover ratios (x)
Asset Turnover (Gross Block)
2.0
1.9
1.4
1.1
1.1
1.1
Inventory / Sales (days)
92
88
103
111
96
97
Receivables (days)
49
48
46
46
52
52
Payables (days)
42
45
43
90
60
60
WC cycle (ex-cash) (days)
106
106
113
97
74
74
Solvency ratios (x)
Net debt to equity
0.3
0.3
0.3
0.2
0.2
0.2
Net debt to EBITDA
0.8
0.7
1.4
1.4
1.0
1.0
Interest Coverage (EBIT / Int.)
14.3
23.3
11.4
4.1
8.6
9.9
June 13, 2016
11
Ipca Laboratories | 4QFY2016 Result Update
Research Team Tel: 022 - 39357800
DISCLAIMER
Angel Broking Private Limited (hereinafter referred to as “Angel”) is a registered Member of National Stock Exchange of India Limited,
Bombay Stock Exchange Limited and Metropolitan Stock Exchange of India Limited. It is also registered as a Depository Participant with
CDSL and Portfolio Manager with SEBI. It also has registration with AMFI as a Mutual Fund Distributor. Angel Broking Private Limited is
a registered entity with SEBI for Research Analyst in terms of SEBI (Research Analyst) Regulations, 2014 vide registration number
INH000000164. Angel or its associates has not been debarred/ suspended by SEBI or any other regulatory authority for accessing
/dealing in securities Market. Angel or its associates including its relatives/analyst do not hold any financial interest/beneficial
ownership of more than 1% in the company covered by Analyst. Angel or its associates/analyst has not received any compensation /
managed or co-managed public offering of securities of the company covered by Analyst during the past twelve months. Angel/analyst
has not served as an officer, director or employee of company covered by Analyst and has not been engaged in market making activity
of the company covered by Analyst.
This document is solely for the personal information of the recipient, and must not be singularly used as the basis of any investment
decision. Nothing in this document should be construed as investment or financial advice. Each recipient of this document should
make such investigations as they deem necessary to arrive at an independent evaluation of an investment in the securities of the
companies referred to in this document (including the merits and risks involved), and should consult their own advisors to determine
the merits and risks of such an investment.
Reports based on technical and derivative analysis center on studying charts of a stock's price movement, outstanding positions and
trading volume, as opposed to focusing on a company's fundamentals and, as such, may not match with a report on a company's
fundamentals.
The information in this document has been printed on the basis of publicly available information, internal data and other reliable
sources believed to be true, but we do not represent that it is accurate or complete and it should not be relied on as such, as this
document is for general guidance only. Angel Broking Pvt. Limited or any of its affiliates/ group companies shall not be in any way
responsible for any loss or damage that may arise to any person from any inadvertent error in the information contained in this report.
Angel Broking Pvt. Limited has not independently verified all the information contained within this document. Accordingly, we cannot
testify, nor make any representation or warranty, express or implied, to the accuracy, contents or data contained within this document.
While Angel Broking Pvt. Limited endeavors to update on a reasonable basis the information discussed in this material, there may be
regulatory, compliance, or other reasons that prevent us from doing so.
This document is being supplied to you solely for your information, and its contents, information or data may not be reproduced,
redistributed or passed on, directly or indirectly.
Neither Angel Broking Pvt. Limited, nor its directors, employees or affiliates shall be liable for any loss or damage that may arise from
or in connection with the use of this information.
Note: Please refer to the important ‘Stock Holding Disclosure' report on the Angel website (Research Section). Also, please refer to the
latest update on respective stocks for the disclosure status in respect of those stocks. Angel Broking Pvt. Limited and its affiliates may
have investment positions in the stocks recommended in this report.
Disclosure of Interest Statement
Ipca Laboratories
1. Analyst ownership of the stock
No
2. Angel and its Group companies ownership of the stock
No
3. Angel and its Group companies' Directors ownership of the stock
No
4. Broking relationship with company covered
No
Note: We have not considered any Exposure below ` 1 lakh for Angel, its Group companies and Directors
Ratings (Based on expected returns
Buy (> 15%)
Accumulate (5% to 15%)
Neutral (-5 to 5%)
over 12 months investment period):
Reduce (-5% to -15%)
Sell (< -15)
June 13, 2016
12